May 2005 Peak Oil Production Topped in Jan 2008
Peak Oil | 12.04.2008 19:27 | Analysis | Ecology | Other Press | Sheffield
The following graphs are from theoildrum.com, where they are introduced with the following text:
"The EIA’s newest International Petroleum Monthly ( http://www.eia.doe.gov/ipm/ ) shows World C+C (Crude Oil plus Condensate) production for January was 74,466,000 barrels per day, eclipsing the heretofore peak of May 2005 by 168,000 barrels per day. (thanks to Ron Patterson for the heads up and to Khebab for the quick graphics)."
http://www.theoildrum.com/node/3835
"The EIA’s newest International Petroleum Monthly (
http://www.eia.doe.gov/ipm/ ) shows World C+C (Crude Oil plus Condensate) production for January was 74,466,000 barrels per day, eclipsing the heretofore peak of May 2005 by 168,000 barrels per day. (thanks to Ron Patterson for the heads up and to Khebab for the quick graphics)." http://www.theoildrum.com/node/3835
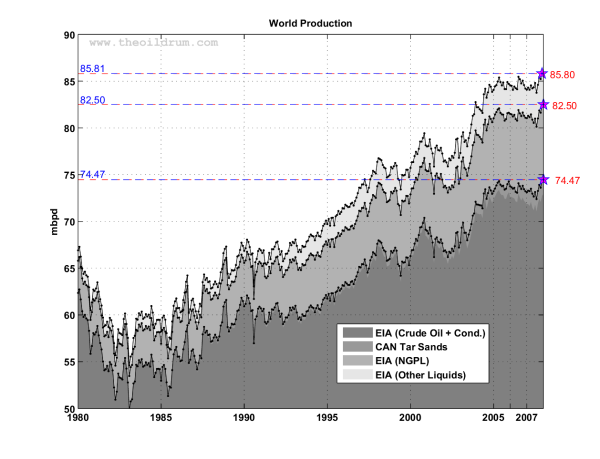
World production (EIA data)
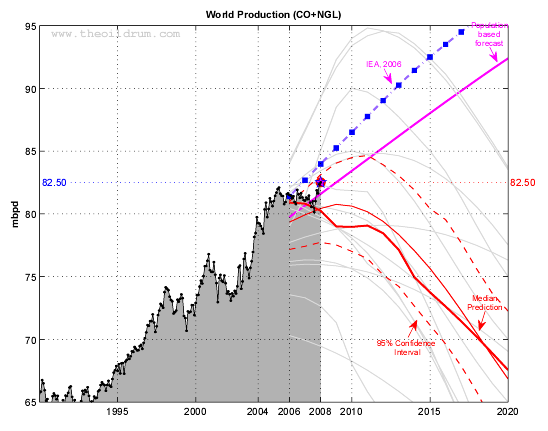
World oil production (EIA Monthly) for crude oil + NGL
Fig 1.- World production (EIA data). Blue lines and pentagrams are indicating monthly maximum. Monthly data for CO from the EIA. Annual data for NGPL and Other Liquids from 1980 to 2001 have been upsampled to get monthly estimates.
Fig 2.- World oil production (EIA Monthly) for crude oil + NGL. The median forecast is calculated from 13 models that are predicting a peak before 2020 (Bakhtiari, Smith, Staniford, Loglets, Shock model, GBM, ASPO-[70,58,45], Robelius Low/High, HSM). 95% of the predictions sees a production peak between 2008 and 2010 at 77.5 - 85.0 mbpd (The 95% confidence interval is computed using a bootstrap technique).
For more info see the comments on theoildrum.com: http://www.theoildrum.com/node/3835#more
Fig 2.- World oil production (EIA Monthly) for crude oil + NGL. The median forecast is calculated from 13 models that are predicting a peak before 2020 (Bakhtiari, Smith, Staniford, Loglets, Shock model, GBM, ASPO-[70,58,45], Robelius Low/High, HSM). 95% of the predictions sees a production peak between 2008 and 2010 at 77.5 - 85.0 mbpd (The 95% confidence interval is computed using a bootstrap technique).
For more info see the comments on theoildrum.com:
http://www.theoildrum.com/node/3835#more
Peak Oil
 Homepage:
http://www.theoildrum.com/
Homepage:
http://www.theoildrum.com/